meta data for this page
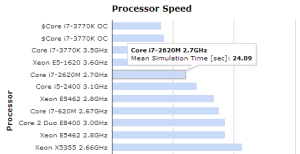
Processor Speed Benchmarks
These tests are carried out using only one processor core in the computer. Simulation time is taken from the EnergyPlus report (eplusout.end) for each job. This time excludes CPU cycles waiting on file I/O etc. However, it is influenced by other activities on the computer during the period of bench-marking.
You are much welcome to send us your speed test results, or models to be included in the test suite.
Benchmarks
(If the bar chart below does not show, please reload this page.)
<html>
<head>
	<script type="text/javascript" src="http://www.google.com/jsapi"></script>
	<script type="text/javascript">
		google.load("visualization", "1", {packages:["corechart"]});
		google.setOnLoadCallback(drawChart);
		function drawChart() {
			// get data from the google spreadsheet
			var query = new google.visualization.Query('https://docs.google.com/spreadsheet/pub?key=0ArvhzGK819TjdEdzamJoWWpqUlJRSDlONFlhRHpNaHc&single=true&gid=1');
			// Return first 15 rows from columns B and E
			query.setQuery('select B, E limit 15');
			// Send the query with a callback function.
			query.send(handleQueryResponse);
		}

		function handleQueryResponse(response) {
			if (response.isError()) {
				alert('Error in query: ' + response.getMessage() + ' ' + response.getDetailedMessage());
				return;
			}
		var data = response.getDataTable();

		var options = {
			width: 700,
			height: 375,
			chartArea: {left: 180, top: 35, width: '71%',height: '79%'},
			//backgroundColor: {stroke: 'black', strokeWidth: 2},
			fontName: 'Verdana',
			title: 'Processor Speed',
			titleTextStyle: {fontSize: 14},
			series: {0: {color: '#C9DAF8'}},
			hAxis: {title: 'Mean Simulation Time [sec]', titleTextStyle: {bold: true, italic: false, fontSize: 12}, textStyle: {fontSize: 10}, gridlines: {count: 6}, viewWindow: {max: 50, min: 0}},
			vAxis: {title: 'Processor', titleTextStyle: {bold: true, italic: false, fontSize: 12}, textStyle: {fontSize: 10}},
			legend: {position: 'none'},
			tooltip: {textStyle: {fontSize: 10}},
		};
		var chart = new google.visualization.BarChart(document.getElementById('chart_div'));
			chart.draw(data, options);
		}
	</script>
</head>
<body>
	<div id="chart_div"></div>
</body>
</html>

Discussion