meta data for this page
Parallel Coordinates Plot Example
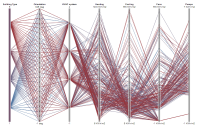
Here is an example of what a Parallel Coordinates Plot looks like with building simulation data. You can try filtering data by selecting a region on a coordinate. This plot type is excellent for visually analyzing sensitive design parameters to given performance indicators.
Sample chart
(If the chart below does not show, please reload this page.)
<html>
<head>
  <title>Parallel Coordinates</title>
  <script type="text/javascript" src="/vis/pcp/protovis.js"></script>
  <script type="text/javascript" src="/vis/pcp/data.js"></script>
  <style type="text/css">
#fig {
width: 880px;
height: 560px;
}
#title {
position: absolute;
top: 70px;
left: 200px;
padding: 10px;
background: white;
}
large {
font-size: medium;
}
  </style>
</head>
<body><div id="center"><div id="fig">
  <script type="text/javascript+protovis">
var dims = pv.keys(units);
/* Sizing and scales. */ var w = 820,
  h = 520,
  fudge = 0.5,
  x = pv.Scale.ordinal(dims).splitFlush(0, w),
  y = pv.dict(dims, function(t) pv.Scale.linear(
      cars.filter(function(d) !isNaN(d[t])),
      function(d) Math.floor(d[t])-fudge,
      function(d) Math.ceil(d[t]) +fudge
      ).range(0, h)),
  c = pv.dict(dims, function(t) pv.Scale.linear(
      cars.filter(function(d) !isNaN(d[t])),
      function(d) Math.floor(d[t])-fudge,
      function(d) Math.ceil(d[t]) +fudge
      ).range("steelblue", "brown"));
/* Interaction state. */ var filter = pv.dict(dims, function(t) {
  return {min: y[t].domain()[0], max: y[t].domain()[1]};
}), active = "model";
/* The root panel. */ var vis = new pv.Panel()
  .width(w)
  .height(h)
  .left(30)
  .right(30)
  .top(30)
  .bottom(20);
The parallel coordinates display. vis.add(pv.Panel) .data(cars) .visible(function(d) dims.every(function(t) (d[t] >= filter[t].min) && (d[t] ⇐ filter[t].max))) .add(pv.Line) .data(dims) .left(function(t, d) x(t)) .bottom(function(t, d) y[t](d[t])) .strokeStyle(“#ddd”) .lineWidth(1) .antialias(false); Rule per dimension. rule = vis.add(pv.Rule)
  .data(dims)
  .left(x);
Dimension label rule.anchor(“top”).add(pv.Label) .top(-12) .font(“bold 10px sans-serif”) .text(function(d) units[d].name); The parallel coordinates display. var change = vis.add(pv.Panel);
var line = change.add(pv.Panel)
  .data(cars)
  .visible(function(d) dims.every(function(t)
      (d[t] >= filter[t].min) && (d[t] <= filter[t].max)))
.add(pv.Line)
  .data(dims)
  .left(function(t, d) x(t))
  .bottom(function(t, d) y[t](d[t]))
  .strokeStyle(function(t, d) c[active](d[active]))
  .lineWidth(1);
Updater for slider and resizer. function update(d) { var t = d.dim; filter[t].min = Math.max(y[t].domain()[0], y[t].invert(h - d.y - d.dy)); filter[t].max = Math.min(y[t].domain()[1], y[t].invert(h - d.y)); active = t; change.render(); return false; } Updater for slider and resizer. function selectAll(d) {
if (d.dy < 3) {
  var t = d.dim;
  filter[t].min = Math.max(y[t].domain()[0], y[t].invert(0));
  filter[t].max = Math.min(y[t].domain()[1], y[t].invert(h));
  d.y = 0; d.dy = h;
  active = t;
  change.render();
}
return false;
}
/* Handle select and drag */ var handle = change.add(pv.Panel)
  .data(dims.map(function(dim) { return {y:0, dy:h, dim:dim}; }))
  .left(function(t) x(t.dim) - 30)
  .width(60)
  .fillStyle("rgba(0,0,0,.001)")
  .cursor("crosshair")
  .event("mousedown", pv.Behavior.select())
  .event("select", update)
  .event("selectend", selectAll)
.add(pv.Bar)
  .left(25)
  .top(function(d) d.y)
  .width(10)
  .height(function(d) d.dy)
  .fillStyle(function(t) t.dim == active
      ? c[t.dim]((filter[t.dim].max + filter[t.dim].min) / 2)
      : "hsla(0,0,50%,.5)")
  .strokeStyle("white")
  .cursor("move")
  .event("mousedown", pv.Behavior.drag())
  .event("dragstart", update)
  .event("drag", update);
handle.anchor(“bottom”).add(pv.Label)
  .textBaseline("top")
  .text(function(d) filter[d.dim].min.toFixed(0) + units[d.dim].unit);
handle.anchor(“top”).add(pv.Label)
  .textBaseline("bottom")
  .text(function(d) filter[d.dim].max.toFixed(0) + units[d.dim].unit);
vis.render();
  </script>
</div></div></body>
</html>
Discussion