meta data for this page
Matrix Plot example
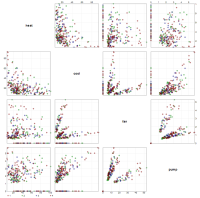
Another excellent example of using Protovis (http://mbostock.github.com/protovis/) for visualizing multi-dimensional data set, in this case, the correlation between various energy consumption components of a collection of office buildings. Try select a region on any scatter plot, and see corresponding cases being highlighted on all scatter plots.
Sample chart
(If the chart does not show, try reload this page.)
<html>
<head>
  <title>Brush + Link</title>
  <script type="text/javascript" src="/vis/mat_chart/protovis.js"></script>
  <script type="text/javascript" src="/vis/mat_chart/results250_2.js"></script>
  <style type="text/css">
#fig {
width: 650px;
height: 685px;
}
  </style>
</head>
<body><div id="center"><div id="fig">
  <script type="text/javascript+protovis">
/* Size parameters. */ var size = 250,
padding = 20;
/* Interaction state. */ var s;
/* Scales for color and position. */ var grey = pv.rgb(144, 144, 144, .2),
  color = pv.colors(
      "rgba(50%, 0%, 0%, .5)",
      "rgba(0%, 50%, 0%, .5)",
      "rgba(0%, 0%, 50%, .5)"),
  position = pv.dict(traits, function(t)
      pv.Scale.linear(flowers, function(d) d[t])
      .range(0, size));
/* Root panel. */ var vis = new pv.Panel()
  .width((size + padding) * traits.length)
  .height((size + padding) * traits.length + padding)
  .left(10)
  .top(5);
/* One cell per trait pair. */ var cell = vis.add(pv.Panel)
  .data(traits)
  .top(function() this.index * (size + padding) + padding / 2)
  .height(size)
.add(pv.Panel)
  .data(function(y) traits.map(function(x) ({px:x, py:y})))
  .left(function() this.index * (size + padding) + padding / 2)
  .width(size);
/* Framed dot plots not along the diagonal. */ var plot = cell.add(pv.Panel)
  .visible(function(t) t.px != t.py)
  .strokeStyle("#aaa");
/* X-axis ticks. */ var xtick = plot.add(pv.Rule)
  .data(function(t) position[t.px].ticks(5))
  .left(function(d, t) position[t.px](d))
  .strokeStyle("#eee");
/* Bottom label. */ xtick.anchor(“bottom”).add(pv.Label)
  .visible(function() (cell.parent.index == traits.length - 1) && !(cell.index & 1))
  .text(function(d, t) position[t.px].tickFormat(d));
/* Top label. */ xtick.anchor(“top”).add(pv.Label)
  .visible(function() (cell.parent.index == 0) && (cell.index & 1))
  .text(function(d, t) position[t.px].tickFormat(d));
/* Y-axis ticks. */ var ytick = plot.add(pv.Rule)
  .data(function(t) position[t.py].ticks(5))
  .bottom(function(d, t) position[t.py](d))
  .strokeStyle("#eee");
/* Left label. */ ytick.anchor(“left”).add(pv.Label)
  .visible(function() (cell.index == 0) && (cell.parent.index & 1))
  .text(function(d, t) position[t.py].tickFormat(d));
/* Right label. */ ytick.anchor(“right”).add(pv.Label)
  .visible(function() (cell.index == traits.length - 1) && !(cell.parent.index & 1))
  .text(function(d, t) position[t.py].tickFormat(d));
/* Frame and dot plot. */ var dot = plot.add(pv.Dot)
  .data(flowers)
  .left(function(d, t) position[t.px](d[t.px]))
  .bottom(function(d, t) position[t.py](d[t.py]))
  .size(10)
  .strokeStyle(null)
  .fillStyle(function(d) s
      && ((d[s.px] < s.x1) || (d[s.px] > s.x2)
      || (d[s.py] < s.y1) || (d[s.py] > s.y2))
      ? grey : color(d.model));
/* Interaction: new selection and display and drag selection */ plot.add(pv.Panel)
 .data([{x:20, y:20, dx:100, dy:100}])
 .cursor("crosshair")
 .events("all")
 .event("mousedown", pv.Behavior.select())
 .event("selectstart", function() (s = null, vis))
 .event("select", update)
.add(pv.Bar)
 .visible(function(d, k, t) s && s.px == t.px && s.py == t.py)
 .left(function(d) d.x)
 .top(function(d) d.y)
 .width(function(d) d.dx)
 .height(function(d) d.dy)
 .fillStyle("rgba(0,0,0,.15)")
 .strokeStyle("white")
 .cursor("move")
 .event("mousedown", pv.Behavior.drag())
 .event("drag", update);
/* Labels along the diagonal. */ cell.anchor(“center”).add(pv.Label)
  .visible(function(t) t.px == t.py)
  .font("bold 14px sans-serif")
  .text(function(t) t.px.replace(/([WL])/, " $1").toLowerCase());
/* Legend. */ vis.add(pv.Dot)
  .data(model)
  .bottom(10)
  .left(function() 15 + this.index * 65)
  .size(8)
  .strokeStyle(null)
  .fillStyle(color)
.anchor("right").add(pv.Label);
vis.render();
/* Interaction: update selection. */ function update(d, t) {
s = d;
s.px = t.px;
s.py = t.py;
s.x1 = position[t.px].invert(d.x);
s.x2 = position[t.px].invert(d.x + d.dx);
s.y1 = position[t.py].invert(size - d.y - d.dy);
s.y2 = position[t.py].invert(size - d.y);
dot.context(null, 0, function() this.render());
}
  </script>
</div></div></body>
</html>
Discussion